🌱 Free USDA zone, frost dates & planting calendar, by ZIP About & data sources
My Planting Zone know your zone

USDA Zone Changes, 2012 to 2023: the Data

Every US ZIP code's hardiness zone on both maps, n = 40,022

Published November 2, 2026 · Data: PRISM Climate Group (Oregon State University) ZIP code files for the USDA ARS 2012 and 2023 Plant Hardiness Zone Maps · n = 40,022 ZIP codes in 52 states and territories

How many US ZIP codes changed zones in 2023

57.1% of US ZIP codes are in a warmer USDA hardiness zone on the 2023 map than on the 2012 map, 41.8% are in the same zone and 1.1% are in a colder one. That is 22,861, 16,722 and 439 of the 40,022 ZIP codes that appear in both of the official PRISM ZIP code files, compared one by one. Nearly all of the moves are a single half zone, which on the map means the average coldest winter night is in the next 5°F band up.

This page breaks those changes down by state, by current zone and by city, and the full ZIP-level table is a CSV download you can reuse under CC BY 4.0. If you only want your own result, the ZIP lookup shows your current zone, and the CSV has the 2012 zone next to it.

Key findings

  • 55.7% of ZIP codes moved exactly one half zone warmer. 551 (1.4%) moved a full zone or more, and 48 moved a zone and a half or more in either direction. The average change is 0.57 half zones. (n = 40,022)
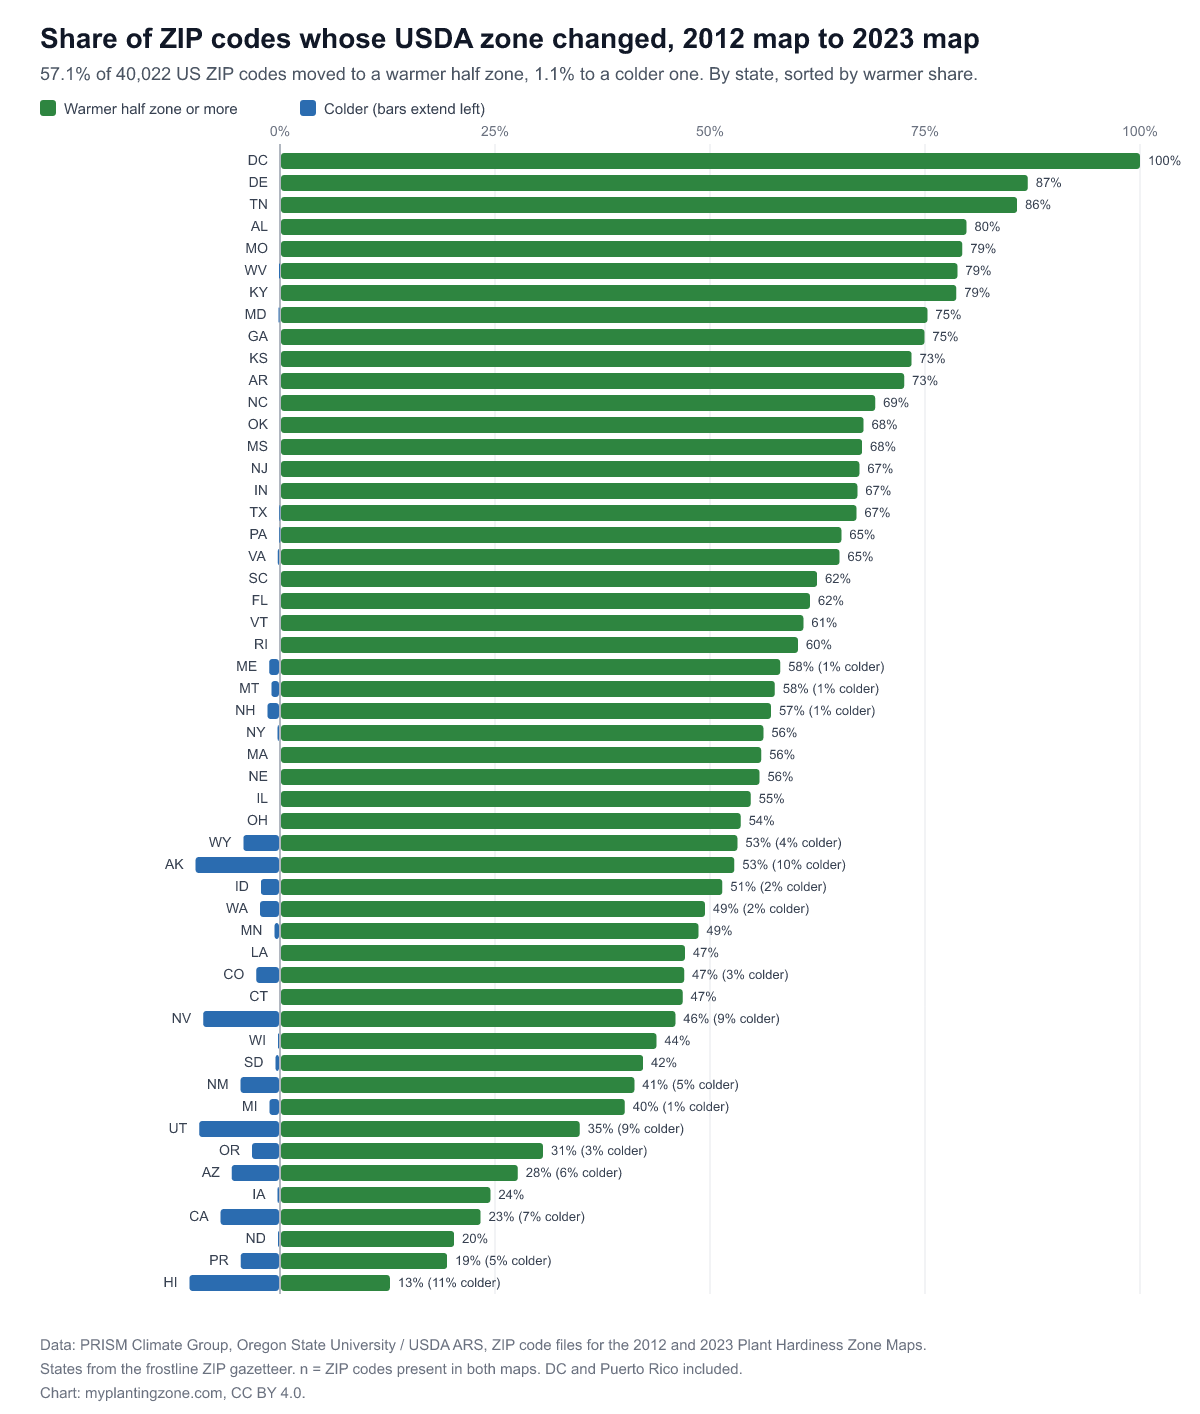
  • The East and South moved most. Every ZIP code in Washington, DC moved warmer (254 ZIP codes, 112 of them by a full zone). The highest shares among the states are Delaware (87%, n = 92), Tennessee (86%, n = 770), Alabama (80%, n = 803), Missouri (79%, n = 1,137).
  • The least change was in the northern Plains, Iowa, California and the islands. Hawaii 13% (n = 133), Puerto Rico 19% (n = 175), North Dakota 20% (n = 405), California 23% (n = 2,521), Iowa 24% (n = 1,038) of ZIP codes moved warmer. California's figure hides a split: 23% warmer, 7% colder, the rest unchanged.
  • Colder zones are a western and island story. The highest shares of ZIP codes that moved colder are in Hawaii (11%), Alaska (10%), Utah (9%), Nevada (9%), California (7%). Those are the states where the 2023 map's extra weather stations and finer terrain modeling changed the picture most, so a colder result usually means a better-resolved cold valley or slope, not a cooler climate.
  • The typical zone moved in 34 of the 50 states, DC and Puerto Rico. In those the most common zone across all ZIP codes changed between the maps, for example Tennessee 7a to 7b, North Carolina 7b to 8a, Texas 8a to 8b, Ohio 6a to 6b, Colorado 5b to 6a.
  • 66 of 95 large cities changed their most common zone. In 21 cities every ZIP code moved warmer, including Houston, Fort Worth, Columbus, Seattle, Oklahoma City, Nashville. In 6 no ZIP code changed at all: Fresno, Sacramento, Chandler, Gilbert, Lubbock, Chesapeake.
Bar chart of the share of each state's ZIP codes that moved to a warmer USDA zone between the 2012 and 2023 maps, from 100% in Washington, DC to 13% in Hawaii, with colder shares shown to the left
Share of ZIP codes that moved warmer (right) or colder (left), by state, n = 40,022. Download the chart (PNG) · Download the data (CSV) · License: CC BY 4.0, credit myplantingzone.com.

Why zones moved

A USDA hardiness zone is a band of the average annual extreme minimum temperature, the coldest night of each year averaged over 30 years, cut into 10°F zones and 5°F half zones. The 2012 map averaged 1976 to 2005 and the 2023 map averages 1991 to 2020, so fifteen years of cold winters in the late 1970s and 1980s dropped out and fifteen milder years came in. That alone pushes many places across a 5°F line.

The other part is method. The 2023 map draws on more weather stations and a finer interpolation, which matters most where the terrain is complicated and stations are sparse. That is why the colder results cluster in the West and in Alaska and Hawaii, and why the largest moves in the dataset are there in both directions. Groveland, California (95321), went from 9a to 6a and Auburn (95604) from 7a to 9b: Sierra Nevada foothill ZIP codes, where elevation changes fast and one zone per ZIP code is a rough summary on either map. Of the 48 ZIP codes that moved a zone and a half or more, 43 are in western states or Alaska.

For a gardener, a half-zone move is a modest change. It can make a borderline perennial worth trying, and it does not change much about the vegetable garden, where the dates that matter are your last and first frost. Our guide to what changed on the 2023 map covers what to do with a new zone, and the planting zones by state chart shows each state's current zone mix.

Zone changes by state

State ZIP codes (n) Warmer Same Colder Full zone or more warmer Most common zone, 2012 to 2023
Washington, DC 254 100.0% 0.0% 0.0% 44.1% 7a to 8a
Delaware 92 87.0% 13.0% 0.0% 0.0% 7a to 7b
Tennessee 770 85.7% 14.3% 0.0% 1.6% 7a to 7b
Alabama 803 79.8% 20.2% 0.0% 0.4% 8a to 8b
Missouri 1,137 79.3% 20.7% 0.0% 3.0% 6a to 6b
West Virginia 839 78.8% 21.1% 0.1% 1.3% 6b to 7a
Kentucky 927 78.6% 21.4% 0.0% 1.2% 6b to 7a
Maryland 591 75.3% 24.5% 0.2% 1.0% 7a to 7b
Georgia 890 74.9% 25.1% 0.0% 0.1% 8a
Kansas 738 73.4% 26.6% 0.0% 0.0% 6a to 6b
Arkansas 693 72.6% 27.4% 0.0% 1.3% 7b to 8a
North Carolina 1,062 69.2% 30.8% 0.0% 0.9% 7b to 8a
Oklahoma 756 67.9% 32.1% 0.0% 0.1% 7a to 7b
Mississippi 523 67.7% 32.3% 0.0% 0.0% 8a to 8b
New Jersey 714 67.4% 32.6% 0.0% 0.3% 7a
Indiana 922 67.1% 32.9% 0.0% 0.3% 6a
Texas 2,554 67.0% 32.9% 0.1% 0.3% 8a to 8b
Pennsylvania 2,091 65.3% 34.6% 0.1% 1.1% 6b
Virginia 1,185 65.1% 34.7% 0.3% 1.4% 7a to 7b
South Carolina 522 62.5% 37.5% 0.0% 1.0% 8a to 8b
Florida 1,410 61.6% 38.4% 0.0% 0.3% 9b to 10a
Vermont 304 60.9% 39.1% 0.0% 4.3% 4b to 5a
Rhode Island 88 60.2% 39.8% 0.0% 0.0% 6b to 7a
Maine 478 58.2% 40.6% 1.3% 3.6% 5b to 5a
Montana 398 57.5% 41.5% 1.0% 4.8% 4a to 4b
New Hampshire 275 57.1% 41.5% 1.5% 1.1% 5b to 6a
New York 2,119 56.2% 43.5% 0.3% 1.0% 5b to 6a
Massachusetts 672 56.0% 44.0% 0.0% 0.6% 6b
Nebraska 608 55.8% 44.2% 0.0% 0.0% 5b
Illinois 1,520 54.7% 45.3% 0.0% 0.4% 5b to 6a
Ohio 1,387 53.6% 46.4% 0.0% 0.7% 6a to 6b
Wyoming 188 53.2% 42.6% 4.3% 8.0% 4b to 5a
Alaska 265 52.8% 37.4% 9.8% 16.2% 4b to 5a
Idaho 315 51.4% 46.3% 2.2% 5.1% 6a to 6b
Washington 688 49.4% 48.3% 2.3% 1.0% 8b
Minnesota 937 48.7% 50.7% 0.6% 0.0% 4b
Louisiana 705 47.1% 52.9% 0.0% 0.1% 8b to 9a
Colorado 617 47.0% 50.2% 2.8% 4.1% 5b to 6a
Connecticut 410 46.8% 53.2% 0.0% 0.0% 6a to 6b
Nevada 224 46.0% 45.1% 8.9% 4.0% 9a to 9b
Wisconsin 868 43.8% 56.0% 0.2% 0.3% 5a to 5b
South Dakota 379 42.2% 57.3% 0.5% 0.3% 4b
New Mexico 415 41.2% 54.2% 4.6% 3.9% 7a to 7b
Michigan 1,145 40.1% 58.7% 1.2% 0.6% 6a
Utah 330 34.8% 55.8% 9.4% 2.4% 6a
Oregon 461 30.6% 66.2% 3.3% 1.7% 8b
Arizona 481 27.7% 66.7% 5.6% 1.2% 9b
Iowa 1,038 24.5% 75.2% 0.3% 0.1% 5a
California 2,521 23.3% 69.8% 6.9% 0.6% 9b
North Dakota 405 20.2% 79.5% 0.2% 0.0% 4a
Puerto Rico 175 19.4% 76.0% 4.6% 2.3% 13a
Hawaii 133 12.8% 76.7% 10.5% 0.0% 12b

Sorted by the share of ZIP codes that moved warmer. States from the ZIP code's place name in the frostline gazetteer. Source: PRISM Climate Group / USDA ARS 2012 and 2023 ZIP code zone files.

Where today's zones came from

Read the other way round: for each zone on the 2023 map, how many of its ZIP codes were in a colder zone in 2012. Zone 11a is the most "new" of the zones with 100 or more ZIP codes: 89% of its 198 ZIP codes were colder on the 2012 map. Zone 13a is the most stable, with 12% of 102. In Hawaii, 77% of ZIP codes kept their 2012 zone.

2023 zone ZIP codes (n) Colder zone in 2012 Same zone in 2012 Warmer zone in 2012
3a 23 47.8% 43.5% 8.7%
3b 230 20.0% 77.4% 2.6%
4a 812 29.9% 68.2% 1.8%
4b 1,281 39.3% 59.6% 1.1%
5a 2,414 43.6% 55.1% 1.3%
5b 2,859 38.3% 61.1% 0.6%
6a 5,148 55.8% 43.5% 0.6%
6b 5,238 64.9% 34.4% 0.7%
7a 4,838 71.8% 27.6% 0.7%
7b 3,812 66.3% 33.1% 0.7%
8a 3,370 65.1% 34.1% 0.8%
8b 3,329 65.0% 34.0% 1.0%
9a 2,131 59.6% 38.0% 2.4%
9b 2,024 40.9% 57.2% 1.9%
10a 1,210 51.5% 45.1% 3.4%
10b 736 41.6% 58.0% 0.4%
11a 198 89.4% 7.6% 3.0%
11b 16 18.8% 75.0% 6.3%
12a 30 3.3% 76.7% 20.0%
12b 136 13.2% 84.6% 2.2%
13a 102 11.8% 83.3% 4.9%
13b 26 76.9% 23.1% 0.0%

Zones 3a to 13b. Alaska's zones 1a to 2b (59 ZIP codes) are in the CSV.

Zone changes in the largest US cities

For 95 of the 100 largest US cities, every ZIP code carrying the city's name, compared across the two maps. A city's "most common zone" is the zone held by the largest number of its ZIP codes, so a city split between two zones can show a change even when only some ZIP codes moved.

# City ZIP codes (n) 2012 zone 2023 zone ZIP codes warmer
1 New York, NY 133 7b 7b 3%
2 Los Angeles, CA 91 10b 10b 2%
3 Chicago, IL 73 6a 6a 56%
4 Houston, TX 178 9a 9b 100%
5 Phoenix, AZ 72 9b 10a 58%
6 Philadelphia, PA 84 7b 7b 43%
7 San Antonio, TX 84 8b 9a 48%
8 San Diego, CA 73 10a 10b 63%
9 Dallas, TX 103 8a 8b 70%
10 Jacksonville, FL 48 9a 9b 88%
11 Austin, TX 72 8b 9a 92%
12 Fort Worth, TX 52 8a 8b 100%
13 San Jose, CA 55 9b 9b 11%
14 Columbus, OH 45 6a 6b 100%
15 Charlotte, NC 71 7b 8a 72%
16 Indianapolis, IN 53 6a 6b 68%
17 San Francisco, CA 49 10b 10b 4%
18 Seattle, WA 51 8b 9a 100%
19 Denver, CO 60 5b 6a 90%
20 Oklahoma City, OK 73 7a 7b 100%
21 Nashville, TN 36 7a 7b 100%
22 Washington, DC 254 7a 8a 100%
23 El Paso, TX 136 8a 8b 97%
24 Las Vegas, NV 64 9a 9b 69%
25 Boston, MA 39 6b 7a 72%
26 Detroit, MI 46 6b 6b 20%
27 Portland, OR 57 8b 9a 54%
28 Louisville, KY 65 6b 7a 69%
29 Memphis, TN 60 7b 8a 85%
30 Baltimore, MD 42 7b 7b 69%
31 Milwaukee, WI 39 5b 6a 72%
32 Albuquerque, NM 39 7b 7b 13%
33 Tucson, AZ 50 9a 9b 40%
34 Fresno, CA 54 9b 9b 0%
35 Sacramento, CA 97 9b 9b 0%
36 Mesa, AZ 19 9b 9b 21%
37 Atlanta, GA 88 8a 8a 56%
38 Kansas City, MO 70 6a 6b 81%
39 Colorado Springs, CO 45 5b 6a 42%
40 Omaha, NE 44 5b 6a 91%
41 Raleigh, NC 43 7b 8a 100%
42 Miami, FL 90 10b 11a 80%
43 Virginia Beach, VA 19 8a 8b 84%
44 Long Beach, CA 23 10b 10b 0%
45 Oakland, CA 25 10a 10a 4%
46 Minneapolis, MN 65 4b 5a 91%
47 Bakersfield, CA 21 9b 9b 0%
48 Tulsa, OK 51 7a 7b 100%
49 Tampa, FL 54 9b 10a 67%
50 Arlington, TX 18 8a 8b 100%
51 Wichita, KS 32 6b 7a 100%
52 Aurora, CO 17 5b 6a 82%
53 New Orleans, LA 61 9b 9b 7%
54 Cleveland, OH 40 6b 7a 80%
55 Honolulu, HI 40 12b 12b 13%
56 Anaheim, CA 16 10b 10b 6%
57 Henderson, NV 9 9a 9b 89%
58 Orlando, FL 56 9b 10a 100%
59 Lexington, KY 36 6b 7a 100%
60 Stockton, CA 17 9a 9b 71%
61 Riverside, CA 16 9b 10a 94%
62 Corpus Christi, TX 30 9b 10a 87%
63 Irvine, CA 12 10a 10b 83%
64 Cincinnati, OH 69 6a 6b 54%
65 Santa Ana, CA 11 10b 10b 36%
66 Newark, NJ 20 7a 7b 95%
68 Pittsburgh, PA 70 6b 6b 40%
69 Greensboro, NC 25 7b 8a 100%
70 Durham, NC 15 7b 8a 100%
71 Lincoln, NE 27 5b 6a 93%
72 Jersey City, NJ 11 7a 7b 55%
73 Plano, TX 9 8a 8b 100%
74 Anchorage, AK 23 4b 5a 78%
75 North Las Vegas, NV 6 9a 9b 67%
77 Madison, WI 31 5a 5b 81%
78 Chandler, AZ 7 9b 9b 0%
79 Gilbert, AZ 5 9b 9b 0%
80 Reno, NV 21 7a 7b 62%
81 Buffalo, NY 44 6a 6b 100%
82 Chula Vista, CA 8 10a 10b 88%
83 Fort Wayne, IN 43 6a 6a 5%
84 Lubbock, TX 25 7b 7b 0%
85 Toledo, OH 31 6b 6b 23%
87 Laredo, TX 7 9a 9b 100%
88 Irving, TX 10 8a 8b 60%
89 Chesapeake, VA 9 8a 8a 0%
90 Glendale, AZ 12 9b 9b 8%
93 Scottsdale, AZ 15 9b 10a 53%
94 Garland, TX 10 8a 8b 100%
95 Boise, ID 27 7a 7a 7%
96 Norfolk, VA 20 8a 8b 100%
97 Spokane, WA 27 6b 7a 89%
98 Richmond, VA 45 7a 7b 76%
99 Fremont, CA 5 10a 9b 0%
100 Huntsville, AL 23 7b 8a 100%

Ranked by Census Vintage 2023 population. Cities with fewer than 3 matching ZIP codes are left out (5 of 100).

Methodology

Zones. The PRISM Climate Group at Oregon State University, which produced both maps with USDA's Agricultural Research Service, publishes a file that assigns one hardiness zone to each ZIP code, for the lower 48, Alaska, Hawaii and Puerto Rico. We downloaded the 2012 files (41,120 ZIP codes) and the 2023 files (40,502) and compared them ZIP code by ZIP code. The change is counted in half zones: +1 means one 5°F band warmer.

Which ZIP codes. A ZIP code is counted when it is in both PRISM files and in the 40,657 ZIP codes behind this site's lookup, which supply the city and state: 40,022 in all. The 2023 zone in the PRISM file matches the zone the lookup shows for every one of them.

States and cities. State shares divide by the number of matched ZIP codes in that state. City rows use every ZIP code whose place name matches one of the 100 most populous cities (Census Vintage 2023), which leaves out ZIP codes inside a city that carry a neighborhood or suburb name.

What was not measured. The ZIP code files carry the zone only, not the temperature, so this dataset cannot say how many degrees a place warmed: a ZIP code just below a 5°F line can change zone with a fraction of a degree, and one in the middle of a band can warm by several degrees without changing. Every ZIP code counts once, so the shares are not weighted by area or population; dense eastern states with many small ZIP codes weigh more than their land area, the mountain West less. ZIP codes that exist in only one of the two files (1,098 from 2012, 480 from 2023, mostly retired or new codes) are left out. We did not separate how much of each change is climate and how much is the new map's method; the USDA itself says both played a part. A zone is a single value for the whole ZIP code, and large rural or mountain ZIP codes span several zones in reality.

Reproduce it. The script is scripts/build-zone-shift.mjs in this site's source; it downloads the eight PRISM files and rebuilds the JSON, CSV and chart. Compiled 2026-11-03.

Cite this data

My Planting Zone, "USDA Zone Changes 2012 to 2023: Data for 40,022 ZIP Codes," November 2, 2026, https://myplantingzone.com/planting-zone/usda-zone-changes-2012-2023-data/. Underlying data: PRISM Climate Group, Oregon State University, and USDA Agricultural Research Service, 2012 and 2023 USDA Plant Hardiness Zone Map ZIP code files.

To see your current zone and frost dates, use the ZIP lookup, or open the planting zones chart for every half zone's temperature band and planting calendar.

Frequently asked questions

How many places changed USDA zones in 2023?

Of 40,022 US ZIP codes that appear in both the 2012 and 2023 PRISM ZIP code files, 22,861 (57.1%) are in a warmer half zone on the 2023 map, 16,722 (41.8%) did not change and 439 (1.1%) are in a colder one. Almost every move was a single half zone: 22,310 ZIP codes, 55.7% of the total.

Which states changed zones the most?

By share of ZIP codes that moved warmer: Washington, DC 100%, Delaware 87%, Tennessee 86%, Alabama 80%, Missouri 79%. The smallest shares were Hawaii 13%, Puerto Rico 19%, North Dakota 20%, California 23%, Iowa 24%.

Did any places get a colder zone?

Yes, 439 ZIP codes (1.1%). They cluster in mountain and island states: Hawaii 11%, Alaska 10%, Utah 9%, Nevada 9%, California 7% of ZIP codes. Most of these reflect the 2023 map's denser station network resolving cold valleys and slopes that the 2012 map smoothed over, not a cooling climate.

Does a new zone change my frost dates?

Not directly. A hardiness zone is the average coldest night of the year; frost dates are the timing of the last spring and first fall freeze, and they come from different station records. A half-zone move means the average coldest night is about 5°F warmer on the new map, which changes which perennials survive, but your planting calendar should still be counted from your local frost dates.

Can I use this data?

Yes. The CSV and chart are published under CC BY 4.0: reuse them with a credit to myplantingzone.com and a link to this page. The underlying USDA and PRISM zone data are public.